Well, I have spent the last couple of days exploring EPM by
breaking it into bits and pieces… And by breaking into bits and pieces means, I
have crashed my environment and finally my system could not take any more abuse
and I had to delete the whole installation and start over… But, learned some
really cool things…
So, first off, let us start with how to validate the health
of the EPM installation that you have. Now, it is very common that you may want
to check the health of your EPM infrastructure. EPM is now a complex web of
components, held together by baling wire and it is quite possible that you may
have some components that fail… (In terms of probability, if you have n
components, the probability that at least one component may fail is equal to 1 –
[probability that none of the components fail] ….so call me superstitious, but
it pays to know which utility to run in case I need to have a quick summary of
what is messing up my environment)
Now, the utility that is used to validate my EPM
installation is called, drumrolls please, validate.bat (no surprises that it is
called validate…It would have been a different story if it had a cool name
though, like Xerxes or Aggamennon)
The path of this file is basically <EPM SYSTEM Home>\user_projects\epmsystem?\bin\ as shown in
the below snapshot. This is the same path where the stop and start batches used
to startup and shutdown the EPM environment is present.
On running this utility, it will check all the components
that are installed on the particular machine… So it will check the database
connectivity, Oracle HTTP server and so on…
Snapshots of running the utility is as shown in the next
couple of snapshots.
In the below snapshot, the utility is checking the connectivity
to the RDBMS schemas
Checking connection to 19000 port fails with a connect error
since I have messed up the Weblogic configuration.
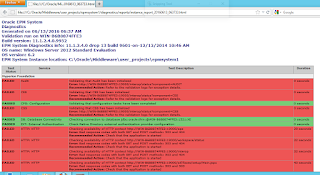
Once the utility finishes running, it will generate the
status report as an HTML file and open it in the browser for you.
By default this report is stored at <EPM Middleware home>\user_projects\epmsystem?\diagnostics\reports\
folder and will have the timestamp information in the file name.
Information includes the timestamp when the diagnostics were
run, version of EPM, server name where validation was run and other
information.
Now, in the above snapshot, port 19000 is closed, so all the
weblogic connect statements are failing…
Below snapshot has some components that are validating
successfully, like my Essbase environment. So now, if I was in firefighting
mode in this server, I would know that something is causing my port number
19000 to not be open and all my issues (for want of a better word) can be
tracked back to this port… Valuable information (actionable insights is how I would
like to describe the reports) since it tells us exactly which component is
failing.


No comments:
Post a Comment