In this blog, I would be talking about how to read a Hyperion EPM Install logs. Although not needed to be done on a regular basis, it is still important to know how to read the log since its handy the day when all things go wrong. (For example, the ODI install failing in the root mode…Could only be debugged by reading the log file.. http://exploitsinhyperion.blogspot.in/2016/11/fdmee-install-failing-on-linux-box-in.html )
The Hyperion EPM install that I did is made up of the following components: -


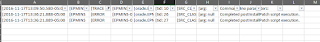
The first field is basically a timestamp entry of when the entry was logged. The second field is basically the status of the log entry as shown in the below snapshot.


Trace basically lists out the steps that were done during a component install. It is more like an install stack trace that can be used for walking through the steps of the install. A snapshot of the TRACE instruction is as shown in the below snapshot.

NOTIFICATIONS list out important status messages like successful install of components, files check and so on. We would be using this for checking the install sequence of the components. A list of NOTIFICATIONS captured in the install log is as shown in the below snapshot.


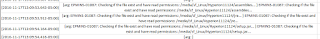
The next snapshot lists the installer checking that the user has access to the files that will be used during the install. The installer checks access to the setup.jar, the assemblies files and the JRE.


I now format the install logs to get the time stamp field from the log file and take a difference between the start time and the end time as shown in the below snapshot. I take the difference between the start and end time to see how much time the components take to install.


The ODI engine takes a bulk of install time, followed with Weblogic and Oracle common components. The other components are pretty straight forward and install in less than a minute each.
The Hyperion EPM install that I did is made up of the following components: -
- Hyperion Foundation
- Calculation Manager
- Planning
- Essbase
- FDMEE
The install log is as shown in the below snapshot.
The log in a text editor is as shown in a below snapshot.

The log file is basically made up of entries enclosed in square brackets. Since manipulating the columns is a bit tedious in a text editor, I copy paste it into an Excel sheet and do a text-to-column using the “]” as a delimiter.
The file in Excel is as shown in the below snapshot.
The file in Excel is as shown in the below snapshot.

The first field is basically a timestamp entry of when the entry was logged. The second field is basically the status of the log entry as shown in the below snapshot.

The entries in the status column is as follows: -
- ERROR
- NOTIFICATION
- TRACE
- WARNING
The errors status basically lists out the errors that were encountered during the install. The below snapshot shows the errors that exist in the given install. (Although the install went perfectly, it looks like it noted a NULL pointer exception as an error)
The warnings encountered during the install is as shown in the below snapshot.

Trace basically lists out the steps that were done during a component install. It is more like an install stack trace that can be used for walking through the steps of the install. A snapshot of the TRACE instruction is as shown in the below snapshot.

NOTIFICATIONS list out important status messages like successful install of components, files check and so on. We would be using this for checking the install sequence of the components. A list of NOTIFICATIONS captured in the install log is as shown in the below snapshot.

I copy paste the NOTIFICATIONS into a separate tab.

I now keep just the timestamp column and the message in the sheet and format the columns a bit as shown in the below snapshot. The first few entries are the installer creating log streams for logging information and errors.

The next snapshot lists the installer checking that the user has access to the files that will be used during the install. The installer checks access to the setup.jar, the assemblies files and the JRE.
The next snapshot lists the LOCALE selected for install and the various states that the install wizard goes through.

The next snapshot shows the log file name and error file names that would be used by the installer.
The next snapshot shows the Weblogic component install being started and it finishing successfully.
I now format the install logs to get the time stamp field from the log file and take a difference between the start time and the end time as shown in the below snapshot. I take the difference between the start and end time to see how much time the components take to install.

The next table shows the time taken to install the components in my environment.

The ODI engine takes a bulk of install time, followed with Weblogic and Oracle common components. The other components are pretty straight forward and install in less than a minute each.
No comments:
Post a Comment