Well, in this blog, we are not going to dwell specifically into Hyperion or any business intelligence or data modelling tools as such. We are basically going to be looking at numbers in a plain old spreadsheet and we are going to see why business intelligence or data modelling with a dash of economics helps in predicting a lot about business behavior by just running what-if scenarios. So the source for this modelling exercise was this. I was in a queue reading a paper when I happened to chance upon an article which dealt with basically the local body transportation authority increasing the fares of the daily ticket pass. The article is present below.
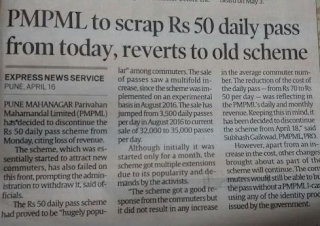
The daily ticket pass basically means that you can use it to travel in any bus anywhere in a day after paying INR 50. Now the reason why I got interested was this. Prior to August 2016, the fare of a daily ticket pass was INR 70 and the average sales of daily pass tickets on a daily basis was around 3500. After slashing the fares to be INR 50, the average sales of daily pass tickets had a steep climb and it averaged between 32000 to 35000.However, the local transport authority claims to have a loss of revenue in spite of increased sale of daily pass tickets. It sounded fishy and I wanted to see if there was a mathematical reasoning for this…
Now for baseline, we know that on a daily basis around 3500 daily passes were sold which are priced at INR 70. Assuming that we have a total of 21 business days in a month, projected revenue total comes out to be approximately 3500*21*70 which is equal to INR 5,145,000.
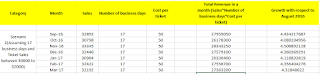
I now created a simple excel grid, as shown in the below snapshot, to see the increase in revenue for the increase in sales of daily passes.

For sales in a day, I took a random value between 30500 to 35000. Number of business days I reduced to be 18 and the cost of a daily pass is set at 50.
The total projected Revenue that we got for a month is as shown in the above snapshot.
The growth in revenue is calculated as follows: (Projected Revenue in Month – Revenue in August 2016) / (Revenue in August 2016)
If you look at the above table, you will see that the growth in Revenue is almost 4 times the revenue in August 2016.
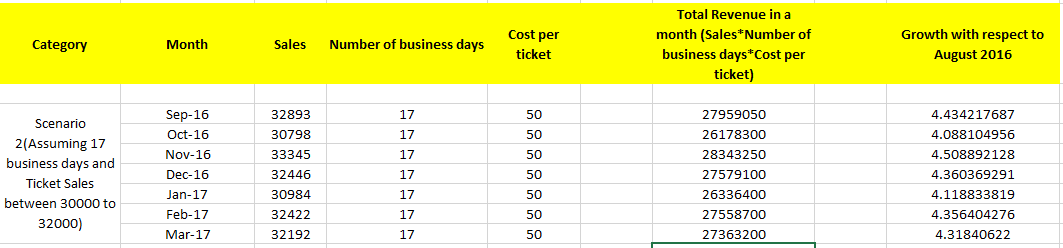
I modelled a few more scenarios as shown in the below snapshots. All of them had a healthy growth in revenue with respect to August 2016.
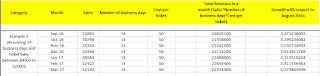
Assuming you do business for 21 days, the projected revenue from ticket sales should increase at almost 5.5 times the August 2016 revenue as shown in the below snapshot.

I also ran a simulation to see what would happen to projected revenue if increase the daily pass ticket fare to INR 70 and lose 10 percent to 20 percent of the users’ dues to high cost. The numbers is as shown in the below snapshot.


Even with increased fare, the projected revenue would be like almost 6 times the Revenue in August 2016. The question now is, given that increase in sales of daily passes should result in an increase in revenue in the coffers, why don’t we see it?
The below table shows the one-way ticket fare for an adult based on the distance travelled in kilometers.

So, if you travel a distance between 0 to 2 kms, you would have to pay a one-time fare of INR 5 and so on.
Now, if you see the above fare table, you can easily calculate that the average fare is 390/12=32.5. This is where economics comes into play.
Suppose you are travelling to-and-fro the maximum distance that you can, which is 60 KM, at a fare of INR 60. Rather than paying 60*2=120 as a fare for going and coming back, it makes more sense to buy a daily pass at INR 50 and save almost INR 70 in exchange. This is true for most of the fares that are above INR 25. Also, assume that you want to travel someplace in the morning, come back and travel someplace else in the evening. In this scenario also it makes more sense to buy the daily ticket pass than having to pay four individual ticket fares. The only ones for whom buying the daily ticket fare would not be profitable is for those travelling distances less than 10KM.
Now, this is where assumptions come into the picture. Assuming people behave rationally (not always) and that they work on principles of economics (happens most of the times, knowingly or unknowingly), I created a model with the following assumptions:
• People who travel less than 10KM do not buy a daily pass ticket since it is expensive and does not add value.
• People who travel a distance 0KM to 15KM may or may not opt for a daily pass. Assume that 10 percent of the sample size opts for a daily pass.
• Keeping a sample size of the population to be 100.
Now keeping all of these assumptions in mind, I ran a calculation to see the projected revenue, which is as shown in the below table:

Projected Revenue by ticket sales is calculated as 100*Fare
Projected Revenue by ticket sales and daily pass is calculated as : (People opting for daily pass*50) + (people opting for ticket*one way ticket fare)
Even with this modelling, daily pass ticket sales should be sizeable and add to revenue. However, this doesn’t happen, because we have not considered two very important factors in the equation.
Understanding Skewed Nature of sales of one-way ticket:
The sales of tickets would follow a normal distribution. However, this would be slightly skewed since you would have a lot of people opting for travel the average distance like 15KM to 25KM, give or take -10 KM. Assuming that this skew pattern holds, I created a model to get a simple skew ratio factor as shown in the below diagram:

In the above diagram, a majority of the users would be travelling in the 10KM to 32 KM range and very few travelling distance above 32KM.

Now, I assumed that 10 percentage of people who travel distance between 10KM to 20KM opt for a daily pass.
Keeping these factors in mind and running the calculation once again, we get some interesting numbers.
Now, for around trip, the total revenue in both the scenarios is as follows:
This number explains why you are in the red and the statement that increase in sales did not correspond to increase in revenue is somewhat mathematically correct assuming all our assumptions hold..
Understanding why Business Intelligence would have helped:
Now, let us come to the part where simple prediction, data modelling or business intelligence would have helped.
Seeing that this entire model is created with bare minimum data (a newspaper article!) and simple information available openly, I find it hard to believe that it took them almost 6 months to realize that the revenue was getting impacted. The impact would have been visible with a month or two when they saw that tickets priced above INR 25 drop significantly.
Secondly, before implementing the reduction in the price of the daily pass, a simple what-if projection on the numbers in excel (not even going to sophisticated tools) using the data that is available would have given the projected impact on revenue this move would have.
Conclusion:
The only conclusion I can draw from this exercise is that it just reiterated that data is the real currency in today’s business world and if you are not able to model that data and come up with sufficient insights into your business processes, you might as well shut shop and be done for the day…

The daily ticket pass basically means that you can use it to travel in any bus anywhere in a day after paying INR 50. Now the reason why I got interested was this. Prior to August 2016, the fare of a daily ticket pass was INR 70 and the average sales of daily pass tickets on a daily basis was around 3500. After slashing the fares to be INR 50, the average sales of daily pass tickets had a steep climb and it averaged between 32000 to 35000.However, the local transport authority claims to have a loss of revenue in spite of increased sale of daily pass tickets. It sounded fishy and I wanted to see if there was a mathematical reasoning for this…
Now for baseline, we know that on a daily basis around 3500 daily passes were sold which are priced at INR 70. Assuming that we have a total of 21 business days in a month, projected revenue total comes out to be approximately 3500*21*70 which is equal to INR 5,145,000.
I now created a simple excel grid, as shown in the below snapshot, to see the increase in revenue for the increase in sales of daily passes.

For sales in a day, I took a random value between 30500 to 35000. Number of business days I reduced to be 18 and the cost of a daily pass is set at 50.
The total projected Revenue that we got for a month is as shown in the above snapshot.
The growth in revenue is calculated as follows: (Projected Revenue in Month – Revenue in August 2016) / (Revenue in August 2016)
If you look at the above table, you will see that the growth in Revenue is almost 4 times the revenue in August 2016.
I modelled a few more scenarios as shown in the below snapshots. All of them had a healthy growth in revenue with respect to August 2016.

Assuming you do business for 21 days, the projected revenue from ticket sales should increase at almost 5.5 times the August 2016 revenue as shown in the below snapshot.

I also ran a simulation to see what would happen to projected revenue if increase the daily pass ticket fare to INR 70 and lose 10 percent to 20 percent of the users’ dues to high cost. The numbers is as shown in the below snapshot.


Even with increased fare, the projected revenue would be like almost 6 times the Revenue in August 2016. The question now is, given that increase in sales of daily passes should result in an increase in revenue in the coffers, why don’t we see it?
The below table shows the one-way ticket fare for an adult based on the distance travelled in kilometers.
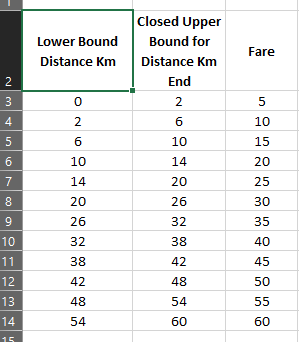
So, if you travel a distance between 0 to 2 kms, you would have to pay a one-time fare of INR 5 and so on.
Now, if you see the above fare table, you can easily calculate that the average fare is 390/12=32.5. This is where economics comes into play.
Suppose you are travelling to-and-fro the maximum distance that you can, which is 60 KM, at a fare of INR 60. Rather than paying 60*2=120 as a fare for going and coming back, it makes more sense to buy a daily pass at INR 50 and save almost INR 70 in exchange. This is true for most of the fares that are above INR 25. Also, assume that you want to travel someplace in the morning, come back and travel someplace else in the evening. In this scenario also it makes more sense to buy the daily ticket pass than having to pay four individual ticket fares. The only ones for whom buying the daily ticket fare would not be profitable is for those travelling distances less than 10KM.
Now, this is where assumptions come into the picture. Assuming people behave rationally (not always) and that they work on principles of economics (happens most of the times, knowingly or unknowingly), I created a model with the following assumptions:
• People who travel less than 10KM do not buy a daily pass ticket since it is expensive and does not add value.
• People who travel a distance 0KM to 15KM may or may not opt for a daily pass. Assume that 10 percent of the sample size opts for a daily pass.
• Keeping a sample size of the population to be 100.
Now keeping all of these assumptions in mind, I ran a calculation to see the projected revenue, which is as shown in the below table:

Projected Revenue by ticket sales is calculated as 100*Fare
Projected Revenue by ticket sales and daily pass is calculated as : (People opting for daily pass*50) + (people opting for ticket*one way ticket fare)
Even with this modelling, daily pass ticket sales should be sizeable and add to revenue. However, this doesn’t happen, because we have not considered two very important factors in the equation.
- The skewed nature of ticket distribution has not been accounted for.
- The return journey loss of revenue has not been accounted for.
Understanding Skewed Nature of sales of one-way ticket:
The sales of tickets would follow a normal distribution. However, this would be slightly skewed since you would have a lot of people opting for travel the average distance like 15KM to 25KM, give or take -10 KM. Assuming that this skew pattern holds, I created a model to get a simple skew ratio factor as shown in the below diagram:

In the above diagram, a majority of the users would be travelling in the 10KM to 32 KM range and very few travelling distance above 32KM.
Now, applying the skewed ticket distribution factor to a sample size of 100, I created a simple table to see the projected revenue on one-way trip and two-way trip and this is shown below.

Now, I assumed that 10 percentage of people who travel distance between 10KM to 20KM opt for a daily pass.
Keeping these factors in mind and running the calculation once again, we get some interesting numbers.
- The daily ticket revenue for sales of one-way ticket is about INR 2475.
- The projected revenue from sale of one way ticket and daily pass on one-way-trip is INR 3035, which is a healthy jump.
- But, if you consider the return journey, no one who travels above 20KM, needs to buy a ticket and the projected revenue on return journey falls to INR 1085.
Now, for around trip, the total revenue in both the scenarios is as follows:
- One way ticket only Revenue on around trip = 2475*2 = 4950
- One way ticket + daily pass revenue on around trip = 3035 + 1085 = 4120
This number explains why you are in the red and the statement that increase in sales did not correspond to increase in revenue is somewhat mathematically correct assuming all our assumptions hold..
Understanding why Business Intelligence would have helped:
Now, let us come to the part where simple prediction, data modelling or business intelligence would have helped.
Seeing that this entire model is created with bare minimum data (a newspaper article!) and simple information available openly, I find it hard to believe that it took them almost 6 months to realize that the revenue was getting impacted. The impact would have been visible with a month or two when they saw that tickets priced above INR 25 drop significantly.
Secondly, before implementing the reduction in the price of the daily pass, a simple what-if projection on the numbers in excel (not even going to sophisticated tools) using the data that is available would have given the projected impact on revenue this move would have.
Conclusion:
The only conclusion I can draw from this exercise is that it just reiterated that data is the real currency in today’s business world and if you are not able to model that data and come up with sufficient insights into your business processes, you might as well shut shop and be done for the day…
No comments:
Post a Comment